Login & Startpage
Login and password
Structure of SmartProcess
Customize start page
Elements on the start page
Customize main menu
Full text search
Workflows and Cases
Create Workflows
Workflow objects
Workflow object: Task
Workflow object: Decision
Workflow object: Forward case
Workflow object: Send e-mail
Workflow object: Start, intermediate and end event
Workflow object: Timer
Workflow object: Parallel gateway
Workflow object: Sub-Process
Workflow object: Incoming message
Workflow object: Send form via e-mail
Workflow object: Service/Export
Form designer
Form fields
General field properties
Field: Text / List without multiple selection
Field: Multiple selection list
Field: Multirow text
Field: Multirow formatable text
Field: Number
Field: Date
Field: Date / Time
Field: Function-Fied
Field: Contact selection
Field: Field group
Field: Catalog fields
Field: Data source for processes and documents
Field: Process and Document fields
Field: Wiki
Field: Free input
The form designer
Workflow basics
Process model of a workflow
Workflow Settings
Rights workflow participants
General placeholders for Word reports in workflows
Case processing
Workflow-Applications
Processes
Menu structure & terms
Process modelling
Process objects
Overview: BPMN objects
Object: Task
Object: Sub-Process
Object: Connectors
Object: Events
Object: Gateways
Object: Pool & Swimlane
Object: Artifacts in general
Object: Artifacts IT System, Resource
Object: Data object Input / Output, Adjacent process
Object: Artifacts KPI, Risk, Control, Opportunity
Object: Artifact Related document
Additional modelling objects
User-defined images as modeling objects
The process designer
Create process groups & processes
Formatting and positioning objects
Reuse & copy objects
Process details
List: Details
User-defined fields
List: Actions
List: Documents
Lists: Terms and abbreviations / Requirements
Lists: Indicator (KPI), Risks, Opportunities
List: Process participants
Process description
Publication and access rights
State and version
Publication of processes / documents
Validity
Read and edit access
Read confirmation
Knowledge questions for read confirmation
Additional features for processes
Documents
Documents - menu structure
Create documents
Document details
Edit files directly in Office
Properties and Placeholders in Word files
Documents - State, version, publication and validity
Organization chart
Reporting
Reporting menu
Reporting for processes and documents
Reporting for cases
Saved reports
Share reports
Excel Report Designer (Additional module)
Catalogs
Settings
Users, permissions & organizational units
Authorization profiles
Introduction authorization profiles
Authorization profile - Tab Workflows / Cases
Authorization profile - Tab Processes
Authorization profile - Tab Documents
Authorization profile - Tab Organization chart
Authorization profile - Tab Reporting
Authorization profile - Tab Contact
Authorization profile - Tab User
Authorization profile - Tab Catalogs
Authorization profile - Tab Wiki
Authorization profile - Tab Administration
Authorization profile - Tab Others
Organizational units and roles
Manage users
Representative
Catalogs
Import
Import of data
Contact import
User import
Organizational unit import
Case import
Meta data import for documents
Emails and text modules
Configure application
Language
Automatic translation
Date and time
Login options and views
Settings for process management
Modeling rules
Symbols for processes and process groups
Process view
Settings for document management
Document templates
Document type
Settings for the organizational chart
Display of the logos
Unavailability for cases for dates
Directory services (AD, Entra ID / Azure AD) and single sign-on
User notifications
Password security
IP Filter (only for SaaS Systems)
API Profile (Additional module)
Manage maintenance access (only for SaaS systems)
Word report designer for printouts (Additional module)
AI Function SmartAI (Additional module)
Audit Trail
Initial configuration SmartProcess - Process and document management
Video tutorials
Video tutorials: Business Process Management
Video tutorial for process participants
Video Tutorial: Workflow Modeling
Video tutorial for working with workflow cases
Video tutorial on audit management
Version & Release notes
Release Notes
Version 24.9 Release Notes
Version 23.10 Release Notes
Version 22.10 Release Notes
Version 22.5 Release Notes
Version 22.3 Release Notes
Version 21.3 Release Notes
Version 9.1.0.10 Release Notes
Version 9.1.0.9 Release Notes
Version 9.1.0.8 Release Notes
Version 9.1.0.7 Release Notes
Version 9.1.0.6 Release Notes
Version 9.1.0.5 Release Notes
Version 9.1.0.4 Release Notes
Version 9.1.0.3 Release Notes
Version 25.11 Release Notes
Version 25.3 Release Notes
Info about version
General
SmartProcess API
Mobile Web App
HTML field
Contacts
File attachments in SmartProcess
Manage Wikis
Use QR codes with SmartProcess
Contact & Forum
Table of Contents
- All Categories
- Reporting
- Excel Report Designer (Additional module)
Excel Report Designer (Additional module)
With the Excel Report Designer (separate module) you can create Excel files from the system which are used as data sources for diagrams, pivot tables, etc. The Excel files are uploaded back to the Sm…
With the Excel Report Designer (separate module) you can create Excel files from the system which are used as data sources for diagrams, pivot tables, etc. The Excel files are uploaded back to the SmartProcess and displayed there.
To start the Excel Report Designer, click on the <Excel Report Designer> button. The report must already have been created as a saved report.

A window will open that allows you to download an empty template for your reports and add your finished Excel reports to a saved report.
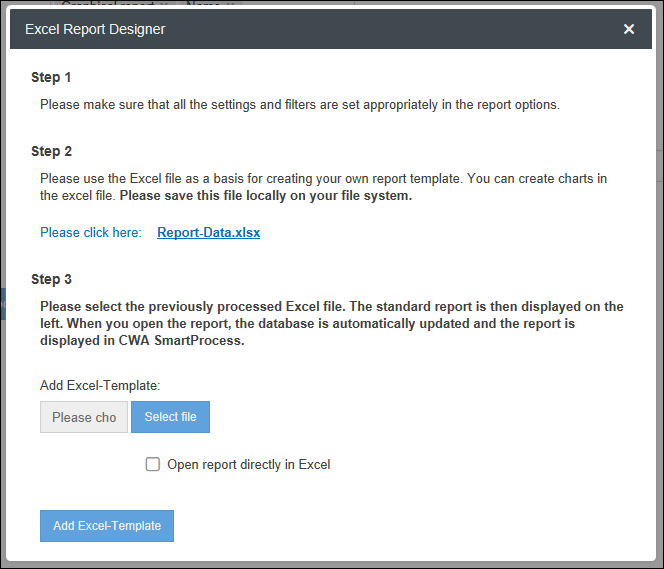
Click on the <Report-Data.xls> link to download your template.
Open the Excel file. The template contains two worksheets. A worksheet with the name of the saved report. It contains the table with the data from SmartProcess that was evaluated. This table serves as a data source for your personal reports in the form of diagrams and so on, and is referenced by your name.
The second worksheet is empty and can be used by you to create reports.
Example:
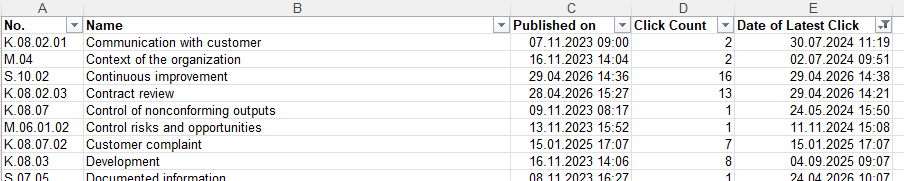
As an example we consider the saved report "Clicks per process and process group", which lists how often a published process or a published process group has been viewed. The object type evaluated is "Process Group and Process". The columns for the report are No., Name, Published on, Click Count and Date of Latest Click.
In the downloaded template there is a spreadsheet "Clicks per process and process group" containing the table "Clicks_per_process_and_process_group" and an empty spreadsheet.
We now want to display the number of views of the published processes as a bar chart. Because the number of records in a report is dynamic, the area to be evaluated in the Excel spreadsheet must also be captured dynamically. This is possible with the MOVE RANGE function, which returns a reference that is offset from the specified reference. The specified reference is the size of the table that we determine using the NUMBER2 function. In order to be able to use this function for the data area of the diagram, we create an entry in the Name Manager that can be referenced in the diagram. To do this, click on <Name Manager> in the "Formulas" tab.
In the name manager we click on <New>. In the field "Name" we enter "Names". This will later give us access to the names of the processes and process groups. The following formula must be entered in the "Refers to" field:
=MOVE.AREA('Clicks per process and process group'!$B$2;;;NUMBER2('Clicks per process and process group'!$B:$B)-1)In this example, the names are in column B of the worksheet, so the reference to this column is made with $B.
Now we create another name for the number of clicks in the same way. In the Name field we enter "Number". Into the field "Refers to" the following formula:
=MOVE.AREA('Clicks per process and process group'!$D$2;;;NUMBER2('Clicks per process and process group'!$D:$D)-1)The number of clicks is shown in column D, therefore the reference is made using $D.
Now we create an empty diagram in the "Report" worksheet. The data source is then added to this diagram. To do this, select <Select data> in the "Draft" tab of the diagram tools.
Next, we add the number of clicks to the diagram. Click on <Add> under "Legend entries".
Enter "Number of clicks" in the Series name field and the following in the Series values field:
='Clicks per process and process group'!number
Then we click on <edit> under "Horizontal axis labels" and enter the following in the field "Axis label area":
='Clicks per process and process group'!names
The diagram is now completely configured.
After creating the diagram, the Excel file can be saved under any name. In our example we save the file as "Click Diagram.xlsx".
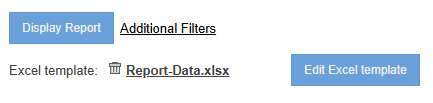
In the Excel Report Designer window, click on <Browse> and select the file. Then confirm by clicking on <Add Excel template>. After a successful upload, you will see which file is stored for the report.
When a report is evaluated in the CWA SmartProcess, all data in the Excel file is automatically updated.
Several saved reports in one file
It is possible to evaluate several saved reports in several spreadsheets in one Excel file. This means that several tables are available as data sources. For example, you can also display a report on workflow and processes and a report for process management together.
As an example, we also want to evaluate the report "Standards and requirements" together with the report "Standards and external requirements". To do this, we create a new spreadsheet in the Excel file and name it like the additional report.
The file can then be saved and uploaded to your report.
How did we do?
Share reports