Login & Startpage
Login and password
Structure of SmartProcess
Customize start page
Elements on the start page
Customize main menu
Full text search
Workflows and Cases
Create Workflows
Workflow objects
Workflow object: Task
Workflow object: Decision
Workflow object: Forward case
Workflow object: Send e-mail
Workflow object: Start, intermediate and end event
Workflow object: Timer
Workflow object: Parallel gateway
Workflow object: Sub-Process
Workflow object: Incoming message
Workflow object: Send form via e-mail
Workflow object: Service/Export
Form designer
Form fields
General field properties
Field: Text / List without multiple selection
Field: Multiple selection list
Field: Multirow text
Field: Multirow formatable text
Field: Number
Field: Date
Field: Date / Time
Field: Function-Fied
Field: Contact selection
Field: Field group
Field: Catalog fields
Field: Data source for processes and documents
Field: Process and Document fields
Field: Wiki
Field: Free input
The form designer
Workflow basics
Process model of a workflow
Workflow Settings
Rights workflow participants
General placeholders for Word reports in workflows
Case processing
Workflow-Applications
Processes
Menu structure & terms
Process modelling
Process objects
Overview: BPMN objects
Object: Task
Object: Sub-Process
Object: Connectors
Object: Events
Object: Gateways
Object: Pool & Swimlane
Object: Artifacts in general
Object: Artifacts IT System, Resource
Object: Data object Input / Output, Adjacent process
Object: Artifacts KPI, Risk, Control, Opportunity
Object: Artifact Related document
Additional modelling objects
User-defined images as modeling objects
The process designer
Create process groups & processes
Formatting and positioning objects
Reuse & copy objects
Process details
List: Details
User-defined fields
List: Actions
List: Documents
Lists: Terms and abbreviations / Requirements
Lists: Indicator (KPI), Risks, Opportunities
List: Process participants
Process description
Publication and access rights
State and version
Publication of processes / documents
Validity
Read and edit access
Read confirmation
Knowledge questions for read confirmation
Additional features for processes
Documents
Documents - menu structure
Create documents
Document details
Edit files directly in Office
Properties and Placeholders in Word files
Documents - State, version, publication and validity
Organization chart
Reporting
Reporting menu
Reporting for processes and documents
Reporting for cases
Saved reports
Share reports
Excel Report Designer (Additional module)
Catalogs
Settings
Users, permissions & organizational units
Authorization profiles
Introduction authorization profiles
Authorization profile - Tab Workflows / Cases
Authorization profile - Tab Processes
Authorization profile - Tab Documents
Authorization profile - Tab Organization chart
Authorization profile - Tab Reporting
Authorization profile - Tab Contact
Authorization profile - Tab User
Authorization profile - Tab Catalogs
Authorization profile - Tab Wiki
Authorization profile - Tab Administration
Authorization profile - Tab Others
Organizational units and roles
Manage users
Representative
Catalogs
Import
Import of data
Contact import
User import
Organizational unit import
Case import
Meta data import for documents
Emails and text modules
Configure application
Language
Automatic translation
Date and time
Login options and views
Settings for process management
Modeling rules
Symbols for processes and process groups
Process view
Settings for document management
Document templates
Document type
Settings for the organizational chart
Display of the logos
Unavailability for cases for dates
Directory services (AD, Entra ID / Azure AD) and single sign-on
User notifications
Password security
IP Filter (only for SaaS Systems)
API Profile (Additional module)
Manage maintenance access (only for SaaS systems)
Word report designer for printouts (Additional module)
AI Function SmartAI (Additional module)
Audit Trail
Initial configuration SmartProcess - Process and document management
Video tutorials
Video tutorials: Business Process Management
Video tutorial for process participants
Video Tutorial: Workflow Modeling
Video tutorial for working with workflow cases
Video tutorial on audit management
Version & Release notes
Release Notes
Version 24.9 Release Notes
Version 23.10 Release Notes
Version 22.10 Release Notes
Version 22.5 Release Notes
Version 22.3 Release Notes
Version 21.3 Release Notes
Version 9.1.0.10 Release Notes
Version 9.1.0.9 Release Notes
Version 9.1.0.8 Release Notes
Version 9.1.0.7 Release Notes
Version 9.1.0.6 Release Notes
Version 9.1.0.5 Release Notes
Version 9.1.0.4 Release Notes
Version 9.1.0.3 Release Notes
Version 25.11 Release Notes
Version 25.3 Release Notes
Info about version
General
SmartProcess API
Mobile Web App
HTML field
Contacts
File attachments in SmartProcess
Manage Wikis
Use QR codes with SmartProcess
Contact & Forum
Table of Contents
- All Categories
- Reporting
- Reporting for processes and documents
Reporting for processes and documents
In the reporting for processes and documents various objects can be evaluated. These include among others: Process groups and processes. Sub-processes and tasks. All artifacts from the process modell…

In the reporting for processes and documents various objects can be evaluated. These include among others:
- Process groups and processes
- Sub-processes and tasks
- All artifacts from the process modelling
- Swimlanes
- Documents
- The objects Org. unit and Role from the organizational chart
- Users created in SmartProcess
Configure list report
Various options can be selected when configuring the report:
Object | Select the object that is to be filtered and sorted by various criteria (for example, process, document) |
Columns | Use the dropdown menu to specify which information should be displayed when the report is executed for the selected object. In the tabular view of the executed report, there will then appear a separate column for each piece of information. |
Name | Enter a search term. If the term appears in the name field of the object, the object is displayed in the report. Example term "Risk" - Only processes that have the word "Risk" in their name will be listed. |
Keyword | Enter a search term. If the term appears in any text field of the object, the object will be displayed in the report. Example term "Risk" - All processes where the word Risk appears in the name field, another text field in the process details, or even a user-defined field will be displayed. For documents, text-based file attachments are also scanned for the term and listed in the report. |
Deleted elements (only for process and document) | If the checkbox is activated, only processes or documents that are in the recycle bin or that have been removed from the recycle bin are included in the report. In this way, even processes and documents that have been removed from the recycle bin can be found and restored if necessary. |
Object published | If the checkbox is activated, only processes or documents that currently have the state "Published" are included in the report. |
Additional filters | By clicking on the link <Additional filters>, further options for filtering the selected object are displayed. The available additional filters depend on the selected object. For processes, these include for example, filtering by validity period expiration, the process owner, the standards & requirements linked to the process, and also user-defined fields. |
Working with the result list
If the report has been configured as desired, the result of the evaluation is displayed by clicking on <Display report>.
By clicking on the line of an entry, you can open the corresponding object and edit it if necessary. You also have further options in the window:
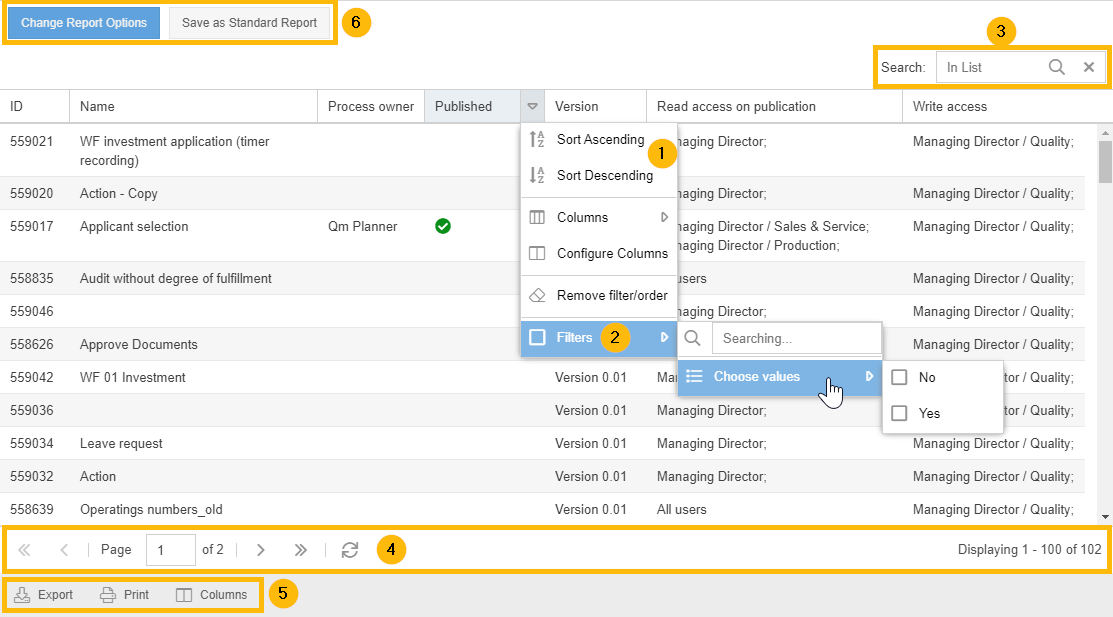
| If you point the mouse at any column header, a drop-down arrow appears at its edge. If you click it, you can sort the results of the report in ascending or descending order by the selected column. Sorting can also be achieved by clicking on the name of the column (in the example: "Published"). You can also use drag & drop to change the order of the columns. |
| In the drop-down menu, the results can also be filtered subsequently according to the values in the corresponding column. The filtering can be done either by a keyword in this column or by the available field values (in the example, only the published processes could be filtered afterwards). |
| Using the search bar, all displayed columns can be filtered for a keyword after executing the report. |
| Below the list of results you will find information on how many results were found in total and can browse through the different result pages if required. A maximum of 100 results are displayed per page of the report. |
|
|
|
Any filtering and sorting that you perform after the report has been executed, for example, using the table columns, does not affect the saved report. |
Configure diagram report
The graphical reporting for processes and documents allows you to create various diagrams for your QM documentation. The operation for setting up the desired parameters is analogous to the operation for the graphical case reports.
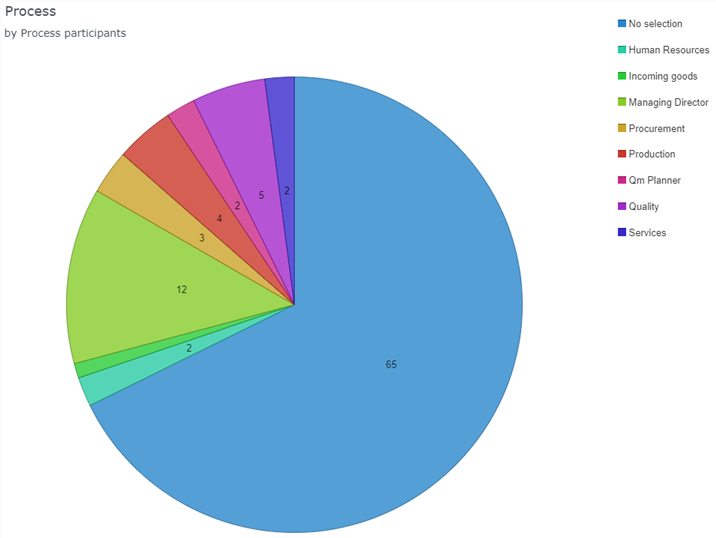
Just as with the list reports, information from all fields can be accessed, for example, to create diagrams on the following topics:
- What is the maturity level of how many processes (if you have created this or other custom fields).
- In which months how many processes lose their validity
- How are users distributed among the existing organizational units
- Which organizational units/roles are involved in processes and how often (see picture below)
How did we do?
Reporting menu
Reporting for cases