Table of Contents
KPI management
With the standard application KPI, corporate key figures can be recorded at regular intervals, be compared to target and limit values and evaluated. This standard workflow is included with every inst…

With the standard application KPI, corporate key figures can be recorded at regular intervals, be compared to target and limit values and evaluated.
However, the sequence of workflow steps and the forms (input masks) can also be flexibly adapted to individual company requirements in the Processes menu.
Sequence of a KPI case
Creation
There are several ways to create a new KPI case:
- With a link to a KPI artifact in the process modeling
- Via the menu cases -> Create -> KPI
- Via the menu KPI -> Create
When a new KPI case is created, the main form is opened where the master data is entered. This includes a unique name for the KPI, a description and a formula that can be entered in the Calculation base field if required.
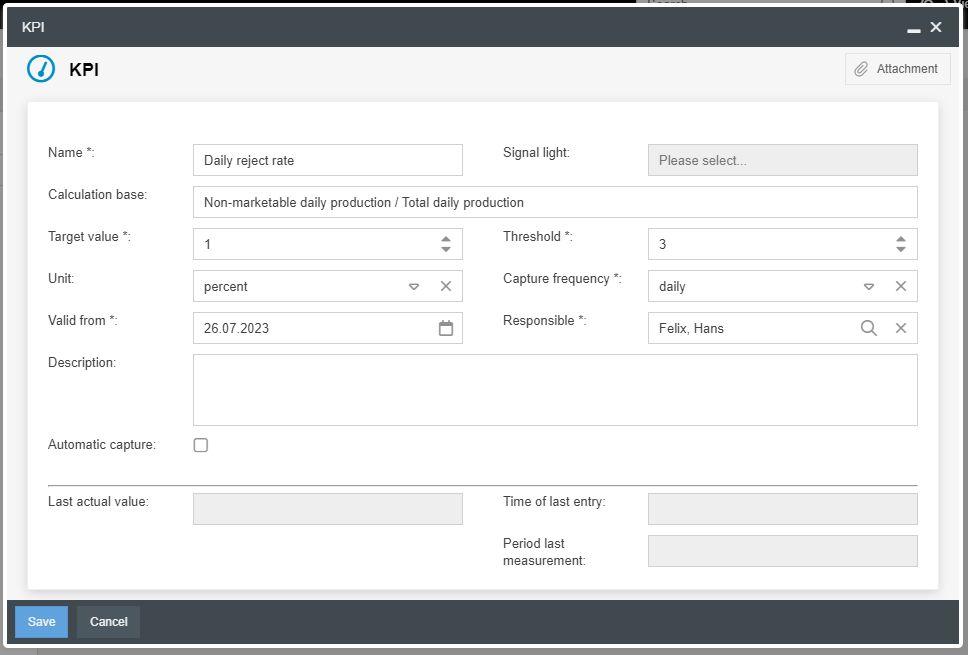
However, the decisive fields for the further course of the KPI recording are:
- Responsible -> After creation, the case is forwarded to this user.
- Capture frequency -> Depending on the capture frequency, the selected responsible person receives the task to record the current value of the day, week, etc. daily, weekly, etc.
- Unit -> Defining the unit helps to enter the value (7 days would be 7 for the unit days and 1 for the unit week)
- Target value and threshold / Signal light -> When the KPI is recorded later, the current actual value is always entered. This value is considered depending on the valid target and threshold value, so that either a green, yellow or red signal light is displayed in the field Signal light (see below).
After clicking on <Save> the case is created and forwarded to the responsible person.
Automatic capture
With the <Automatic capture> it is possible to capture selected information from other workflows as KPI cases. In doing so, the recording is not regularly requested by a user, but is carried out automatically at the selected capture frequency.
In the example of the screenshot, the quantity (Automatic target value) of newly created customer complaint cases (Process type) for which the field "Complaint justified" (Filter field) was set to Yes (Filter value) is recorded every month (Capture frequency).

If automatic capture is selected, no further processing of the KPI case is necessary.
Capture of KPI's
In case of a manual recording, you can see when the next actual value has to be entered after the creation of the case by means of the "Target date" field.
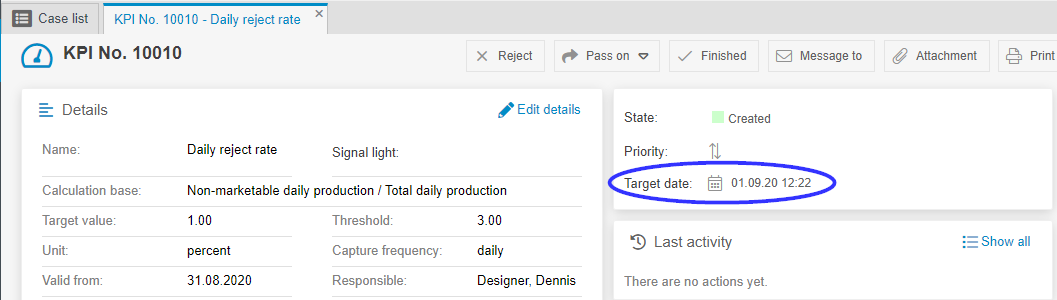
In the example, the recording of the KPI case is therefore requested by the person responsible on 01.09.2020 at 12:22. Directly after the request, the date for the next necessary recording is recalculated. Since a daily capture frequency was specified in the example, the next data entry is requested on 02.09.2020 at 12:22.
If, for example, a daily KPI case is not entered by the responsible person for 3 consecutive days, the responsible person will find a total of 3 open tasks for entering the KPI in his "My cases" list - a separate task for each day.
When the target date is reached, the responsible person is notified by e-mail and sees the requested task in the case list.

In the form of the task the captured value as well as the date on which this value was measured is entered.
- 01.09.2020 with capture frequency Daily -> Measurement period = 2020/09/1
- 01.09.2020 with capture frequency Monthly -> Measurement period = 2020/09
- 01.09.2020 with capture frequency Quarterly -> Measurement period = 2020/3
- 01.09.2020 with capture frequency Yearly -> Measurement period = 2020

From the first entry, a traffic light in the case window provides information on the status of the KPI case:
- Green
 -> The last recorded value is better than the target value of the KPI case
 - Yellow
 -> The last recorded value lies between the target and threshold value of the KPI case
 - Red
 -> The last recorded value is worse than the threshold value of the KPI case
After the data has been entered, the KPI case changes to the status "KPI active" and the person responsible is reminded of the necessary entry on the next target date.
Adjust target and threshold value
In order to be able to put the actual value of a KPI into relation, the currently valid target and threshold values are stored with each data acquisition. Should the internally set targets change over time, the values can be adjusted via <Edit details> in the KPI case window.
So if the next actual value is to be put into relation with adjusted target and threshold values, the target and threshold values have to be adjusted in the case window before the data is entered.

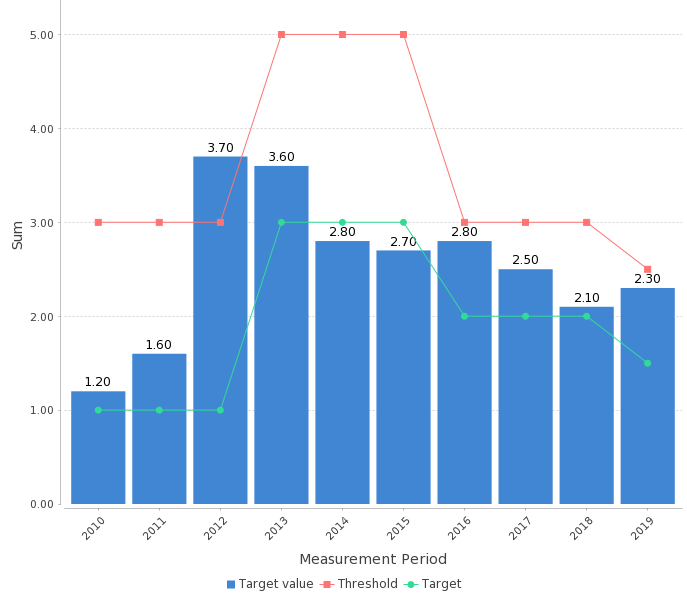
A KPI case whose target and threshold values have been adjusted several times over the course of time, for example, is shown in the reporting as follows:
Overview & evaluation
Element on the start page
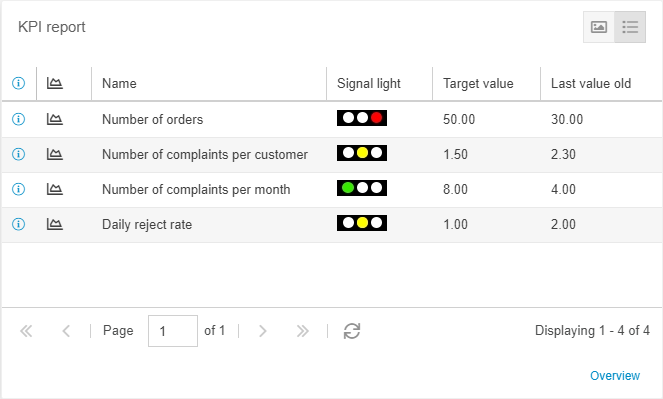
On the start page you can display the element "KPI report". This shows all KPI cases for which you have read access, including the current signal light and the last recorded value. The window offers the following options:
- By clicking on a table row, the case window of the corresponding KPI opens
- By clicking on the link <Overview> the list is displayed with more details in the Reporting menu
- By clicking on the
 icon, an automatic graphic evaluation of the selected KPI case is displayed
 - By clicking on the
 icon, the entries in the "KPI report" window are displayed in a graphical overview instead of a list view
Saved reports
The KPI case menu contains several saved reports provided by SmartProcess:
The saved report KPI contains a list of all cases for which the user has read access.

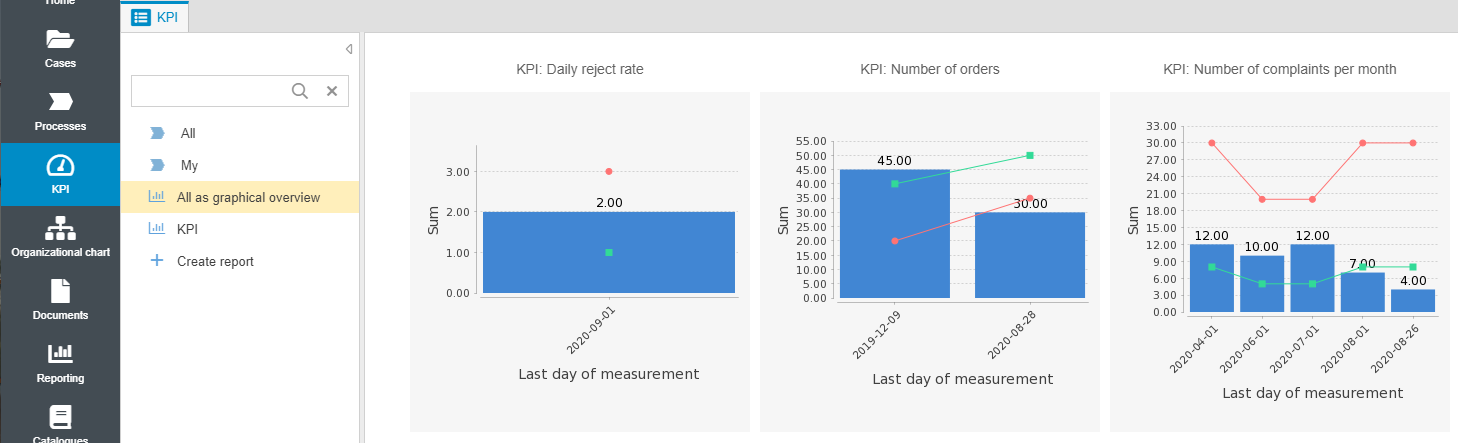
In the saved report All as graphical overview, the last recorded values of each of these KPI cases are displayed in an automatically generated diagram.
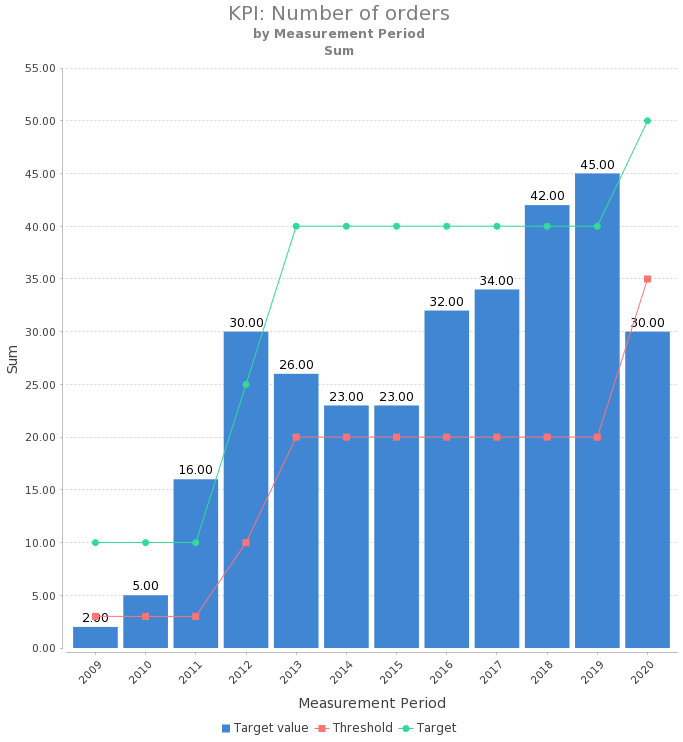
Example: Individual report
Individual evaluations for KPI cases can be created with Reporting for cases.
The following example shows the configuration and result view of a report, in which the recorded values of the KPI case "Number of orders" are displayed with target and threshold values.

How did we do?
Action management
Qualification management (Additional module)